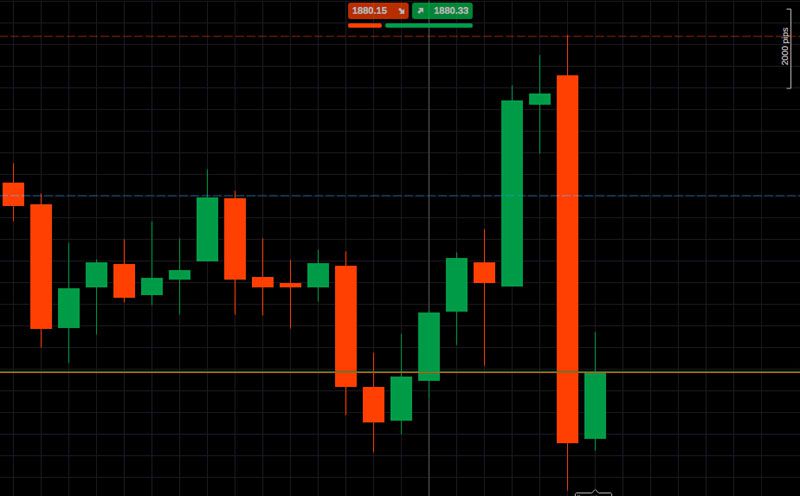
Examining the Use of Candle Stick Charts in Trading
In the vast, complex world of trading, understanding the tools at your disposal is crucial. Candle stick charts are one such tool, offering a detailed view of market movements. With their unique visual representation, traders can assess market patterns and trends at a glance. Below, we delve into the nitty-gritty of these charts, exploring their … Read more
