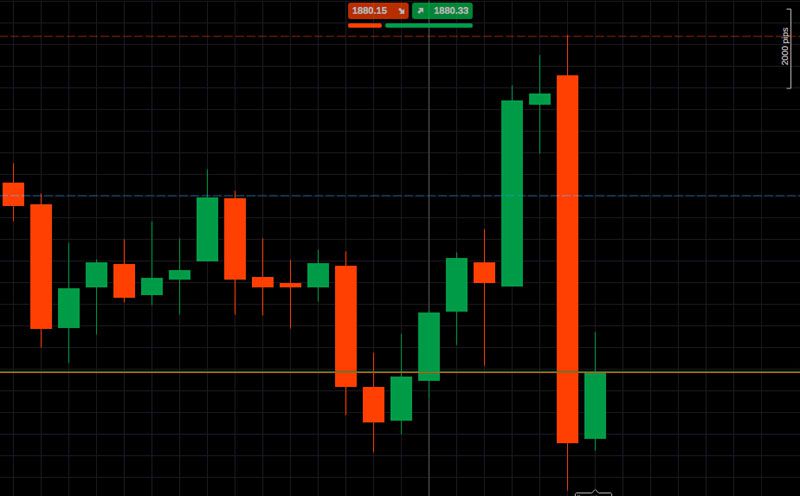
In the vast, complex world of trading, understanding the tools at your disposal is crucial. Candle stick charts are one such tool, offering a detailed view of market movements. With their unique visual representation, traders can assess market patterns and trends at a glance. Below, we delve into the nitty-gritty of these charts, exploring their significance in financial trading.
Understanding the Basics of Candlestick Charts in Trading
Originating from 17th-century Japan, candlestick charts have now become a popular technique among modern traders. They provide a visual representation of price movements in a specific period. Essentially, a candle stick chart is comprised of individual “candles,” each depicting the opening, closing, highest, and lowest price points within a certain period.
Each candle is made up of two main components—the body and the shadow (commonly referred to as the ‘wick’). The body shows the difference between the opening and closing price, while the wick illustrates the price difference from the highest to the lowest point during the trading period. This makes the candle stick charts informative and easy to interpret.
For a newcomer, interpreting these charts might seem intimidating. However, with a bit of practice, one can read the market behavior effectively to anticipate potential future movements. Traders must understand these basic principles before engaging in real trading scenarios.
The unique design of candlestick charts allows savvy traders to predict the potential future movement of a stock’s price. This advantage is why economic analysts and traders worldwide rely heavily on candlestick chart analysis.
The Significance of Colors and Shapes in Candlestick Charts
When looking at a candlestick chart, the colors and shapes of individual candles play a significant role. Typically, if the body of the candle is filled, it indicates that the closing price is lower than the opening price. This situation depicts a bearish market.
Conversely, if the body is hollow or not filled in, it shows that the closing price is higher than the opening price, indicative of a bullish market. Traditionally, red represents a bearish candle and green represents a bullish one.
Next, let’s break down the shapes in a candlestick chart. Candles can take on various shapes based on the relationship between the opening price, closing price, and the highest/lowest prices during that period. These variations form patterns that traders can use to predict future price changes.
In essence, the diverse shapes of candles, together with their associated color signals, provide traders with a more dynamic and informative snapshot of market activity. This nuanced knowledge, in turn, empowers traders to make more informed trading decisions.
Differentiating Bullish and Bearish Scenarios Through Candlestick Patterns
Candlestick charts reveal patterns that indicate bullish or bearish scenarios. These patterns, when identified correctly, can help traders make more effective trading decisions. An understanding of key candlestick patterns is fundamental to assessing the likely future price movement.
Patterns like “Hammers,” “Dojis,” and “Shooting Stars” can indicate reversals, while “Engulfing” and “Hikkake” patterns signal the continuation of the current trend. To be sure, these patterns can appear complex at first, but having a grasp of them can significantly enhance a trader’s market navigation skills.
A bullish scenario reflects rising prices and potentially positive market sentiment, while a bearish one signifies falling prices and possibly negative market sentiment. Recognizing the formation of these patterns through understanding candlestick charts can significantly enhance one’s trading accuracy and confidence.
Moreover, employing these patterns in conjunction with other technical analysis tools could even further increase the success rate of your predictions.
Altogether, a sound understanding of candlestick charts can give you an edge in the volatile world of trading. From indicating potential price reversals to guiding your investment decisions, these charts are more than mere tools – they transform into strategic partners weaving stories about the market, aiding your journey towards financial profit and stability.

Reblog It collaborates closely with clients to develop tailored guest posting strategies that align with their unique goals and target audiences. Their commitment to delivering high-quality, niche-specific content ensures that each guest post not only meets but exceeds the expectations of both clients and the hosting platforms. Connect with us on social media for the latest updates on guest posting trends, outreach strategies, and digital marketing tips. For any types of guest posting services, contact us on reblogit.webmail[at]gmail.com.
